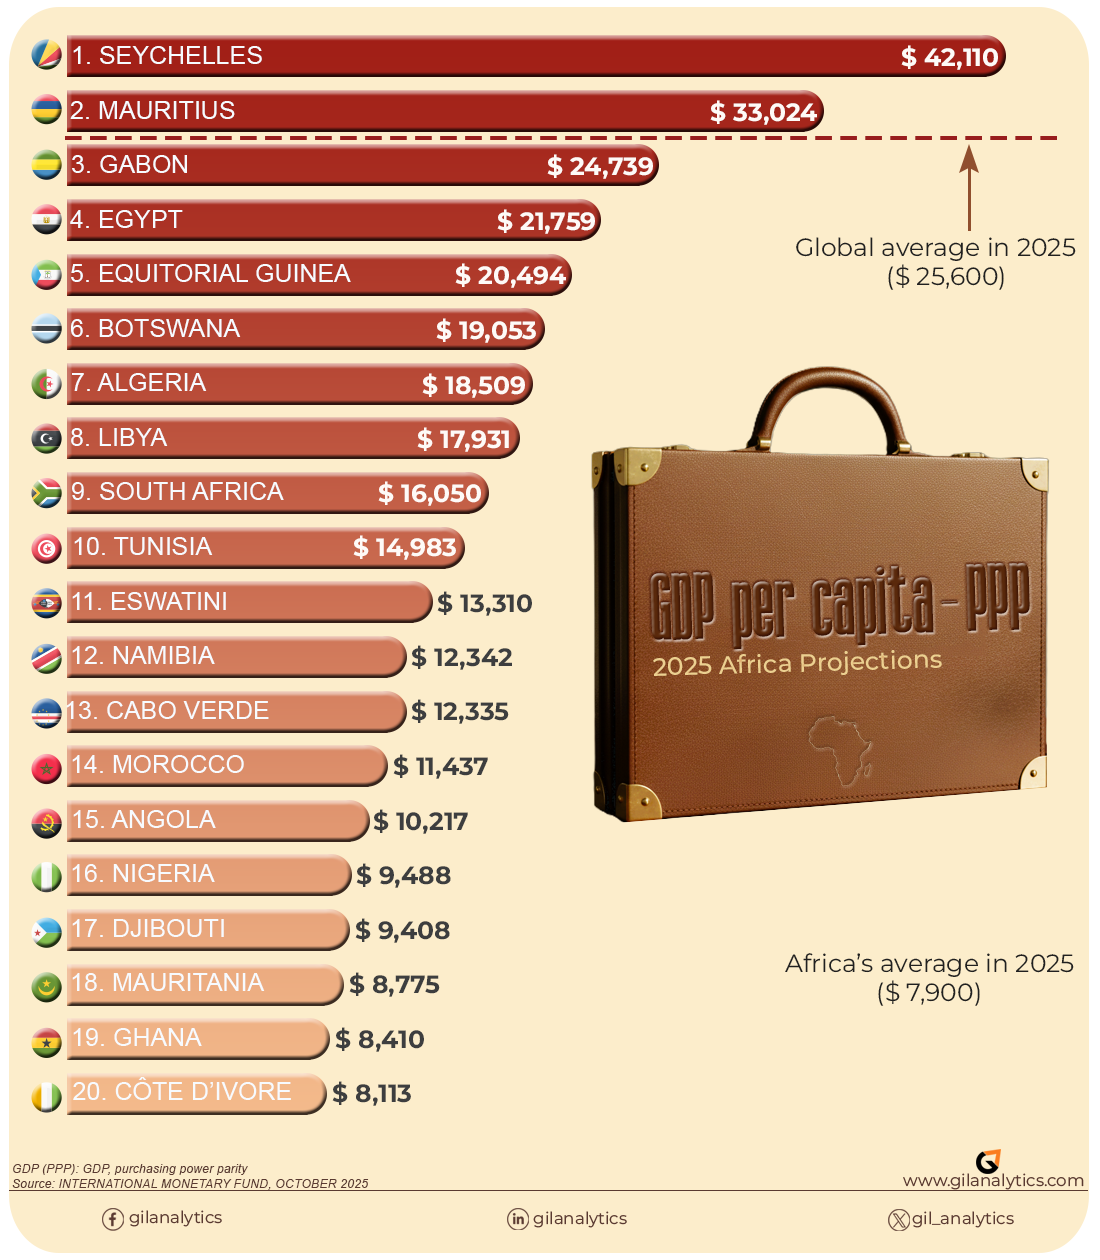
Seychelles is the richest country in Africa in 2025 by GDP per capita at purchasing power parity (PPP), according to the International Monetary Fund report.
Its 2025 GDP per capita is $42,110. Mauritius ranks second at $33,023, and Gabon ranks third at $24,738.
That is the direct answer.
The useful answer, however, needs one more sentence: GDP per capita is an average measure of economic output. It is not a payslip, a bank balance, or a claim that every person in Seychelles is richer than every person elsewhere in Africa.
This article ranks the countries using IMF’s 2025 GDP per capita estimates in USD at PPP. It also compares the 2020 and 2025 figures, explains the difference between total GDP and GDP per capita, and looks at the countries moving fastest in the ranks.
The ranking at a glance
Here are the 10 richest African countries in the table by 2025 GDP per capita:
The tl;dr is this: Seychelles leads on the 2025 level. Cabo Verde leads on growth. Same table, different answer.
What does “richest country in Africa” mean?
Search for the richest country in Africa and you will find more than one answer. That is not always a data problem. Often, people are measuring different things.
Richest by total GDP
Total GDP measures the value of all goods and services produced in an economy over a year.
It answers this question: Which country has the largest economy?
Large populations and broad production bases matter here. Manufacturing, mining, financial services, agriculture, energy, construction, and trade all add to the total.
A country can have the largest economy in Africa without having the highest GDP per capita. A big pie does not tell you the size of each slice.
Richest by GDP per capita
GDP per capita divides GDP by population.
It answers this question: How much economic output corresponds to each person, on average?
Richest by PPP
PPP adjusts for differences in local prices. The same amount of money can buy different quantities of goods and services in different countries. PPP attempts to make the comparison more useful by accounting for that difference.
PPP is helpful. It is also an estimate. It does not measure personal wealth, income distribution, or whether a household feels financially comfortable.
So there are at least three possible answers:
- Largest economy: total GDP
- Highest average output per person: GDP per capita
- Highest output per person after price adjustments: GDP per capita at PPP
For this article, the answer is the third one.
Why Seychelles ranks first
Seychelles is a small island country with a relatively small population. Its economy is connected to tourism, financial services, fisheries, and related services.
Population matters because GDP per capita is a division. The total output is divided across the number of people. Strong output combined with a small population can produce a high per-person figure even when the total economy is much smaller than Egypt’s, Algeria’s, or South Africa’s.
Seychelles records $42,110 in 2025. That puts it $9,086 ahead of Mauritius, the second-ranked country in the table.
The gap is about 27.5%. That sounds settled until you look at the growth column.
Seychelles grows by 33.9% from 2020 to 2025. Mauritius grows by 54.9%. Gabon grows by 55.1%.
Seychelles leads because it starts higher. Mauritius and Gabon are moving faster from lower starting points.
The table has a plot twist. A mild one, but it is there.
The 10 richest countries, explained
1. Seychelles
Seychelles ranks first at $42,110 GDP per capita in 2025.
Its lead comes with the same qualification that applies to every country in this list. GDP per capita is an average. It does not show how output is shared between households or what people pay for housing, food, transport, and healthcare.
Its 2020 figure is $31,455, giving reported growth of 33.9% over the five-year comparison.
2. Mauritius
Mauritius ranks second at $33,023.
Its figure rises from $21,325 in 2020. That is 54.9% growth, well ahead of Seychelles on the change over time.
Mauritius is another small island economy, with activity connected to tourism, financial services, manufacturing, and international trade. Its position shows why the starting level matters. Even with faster growth, it remains behind Seychelles in 2025.
3. Gabon
Gabon ranks third at $24,738.
The country was at $15,952 in 2020 and records 55.1% growth, the highest increase among the top three.
Gabon’s position is an example that GDP per capita can be influenced by resource production as well as by the size of the population. A high average does not tell us whether the benefits are evenly distributed.
4. Egypt
Egypt ranks fourth at $21,758.
Its 2020 figure is $16,551, representing 31.5% growth in the table.
Egypt also illustrates the difference between total GDP and GDP per capita. Its large population and broad economy make it one of Africa’s biggest economies in total terms. A per-person ranking answers a different question.
5. Equatorial Guinea
Equatorial Guinea ranks fifth at $20,493.
It records $16,693 in 2020 and reported growth of 22.8%.
Its high per-person figure should be read with care. A country can record high output per person while still having major differences in income, public services, and household experience. The average is useful. It is not the whole country.
6. Botswana
Botswana ranks sixth at $19,053.
The figure rises from $14,179 in 2020, a reported increase of 34.4%.
Botswana’s ranking is another example of a country appearing high in a per-person table without being one of the continent’s largest economies by total output. The denominator matters.
7. Algeria
Algeria ranks seventh at $18,509.
Its 2020 figure is $12,731, with reported growth of 45.4%.
Algeria is a useful comparison with smaller countries near the top. It has a much larger population and a substantial energy sector. Total economic size and output per person can point in different directions.
8. Libya
Libya ranks eighth at $17,930.
The figure rises from $11,617 in 2020, an increase of 54.3%.
That growth rate is close to Mauritius and Gabon. It shows why a single-year ranking should be read alongside the time comparison. The current level tells us where a country stands. The growth rate tells us how quickly the number changed.
9. South Africa
South Africa ranks ninth at $16,049 in this per-person table.
Its 2020 figure is $12,789, representing 25.5% growth.
South Africa may appear in a different position in a ranking by total GDP. That is expected. Total GDP rewards scale. GDP per capita divides that scale across the population.
This is why articles answering the same search query can name different countries. One may be discussing total economic size. Another may be discussing output per person.
10. Tunisia
Tunisia completes the top 10 at $14,982.770.
It rises from $11,989.274 in 2020, with reported growth of 25.0%.
Tunisia’s position gives the top 10 a useful range. The gap between first and tenth is $27,127.625 per person on the 2025 measure.
Cabo Verde is growing fastest
The richest country and the fastest-growing country are not the same.
Cabo Verde records the largest percentage increase in the supplied table. Its GDP per capita rises from $7,047.730 in 2020 to $12,335.268 in 2025.
That is 75.0% growth.
Cabo Verde ranks 13th by its 2025 level, so it does not appear in the top 10. It does, however, move more quickly than every country above it in the growth column.
Rwanda is close behind at 73.9%. Mauritius records 54.9%, Gabon 55.1%, Libya 54.3%, and Ethiopia 54.0%.
This is the difference between level and momentum:
- Seychelles has the highest 2025 figure.
- Cabo Verde has the highest percentage growth.
- Rwanda is another fast-growing country from a lower base.
- Mauritius and Gabon combine a high level with growth above 54%.
Calling one country “the best” without saying whether you mean level or growth is how rankings become mildly chaotic.
The largest negative outlier is Sudan
Sudan moves in the opposite direction.
Its GDP per capita falls from $4,454.293 in 2020 to $2,418.619 in 2025. The table reports that change as -45.7%.
That is the sharpest decline in the comparison.
The figure deserves attention, but it should not be treated as a complete explanation. Economic numbers can change because of conflict, disruption, inflation, exchange-rate assumptions, population estimates, and later revisions.
The table shows the direction and scale of the change. It does not identify the cause on its own.
The number starts an investigation. It does not finish one.
What the ranking leaves out
GDP per capita is a useful comparison measure. It is not a full measure of wealth or wellbeing.
It does not show:
- how evenly income is distributed
- what a typical household earns
- household wealth and savings
- the cost of housing, food, or healthcare
- unemployment or underemployment
- access to education and public services
- differences between cities and rural areas
- whether economic growth can continue
This matters especially when comparing countries with different population sizes and economic structures. A high average can sit alongside low incomes for many households. A lower average can hide progress in particular sectors or regions.
The measure answers one question well: how much output corresponds to each person, after the PPP adjustment used in the figures.
It should not be asked to answer every other question as well.
Nominal GDP, PPP, and exchange rates
The top three ranking pages for this search use tables and country comparisons, but they do not all use the same measure. Some rank total GDP in nominal US dollars. Others show GDP per capita. Some explain PPP separately.
Nominal GDP uses current prices and exchange rates. If a currency falls against the US dollar, the country’s GDP can look smaller when converted into dollars, even if domestic production has not fallen by the same amount.
PPP tries to reduce that problem by accounting for local price differences. It is often better for comparing what output can buy inside each country.
Neither measure is perfect.
Nominal GDP is useful for comparing the size of economies in international dollar terms. PPP is useful for comparing domestic purchasing power. GDP per capita is useful for comparing output relative to population.
The right measure depends on the question. The question here is the richest country in Africa by GDP per capita at PPP. See the GDP per capita explainer and PPP explainer for the mechanic behind each comparison.
In 2025, the world average GDP per capita (PPP) was approximately $25,591 and only only 2 African nations exceeded it.
Why rankings change from one page to another
You may read one article that names South Africa and another that names Seychelles. That does not automatically mean one writer cannot count.
The pages may be using different years, sources, currencies, or definitions of wealth. A nominal-GDP ranking measures economic output in current US dollars. A GDP-per-capita ranking divides output by population. A PPP ranking adjusts for local prices. Those choices change the result before anyone writes the headline.
Exchange rates can also move a nominal ranking quickly. If a local currency loses value against the dollar, the country’s economy can appear smaller in dollar terms. Domestic production may not have fallen by the same amount. The reverse can happen when a currency strengthens.
Population estimates matter in a per-person ranking. If the population denominator changes, GDP per capita changes too. Revisions to national accounts can also move a figure without a new factory opening or closing that morning.
This is why the year and method belong in the headline. “Richest country in Africa” is incomplete. “Richest country in Africa by 2025 GDP per capita at PPP” tells the reader what is being compared.
It also explains why two rankings can be useful at the same time. A total-GDP table helps someone compare market size. A per-person table helps someone compare average output. A growth table helps someone see momentum. They are different views of the same broad economic picture.
What you should take from the figures
The first takeaway is straightforward: Seychelles leads this pack.
The second is more useful: the lead does not settle every economic question. Mauritius and Gabon grow faster over the comparison period. Cabo Verde grows fastest overall. Sudan falls sharply. Each result changes the story a little.
The third is a reminder about averages. A GDP-per-capita figure of $42,110 does not mean each resident receives that amount. It means the country’s total output, divided by its population and adjusted using PPP, produces that average figure.
That distinction is easy to lose in a listicle. The number looks precise, so the conclusion can start sounding more precise than the measure is. Three decimal places do not create three extra layers of certainty.
Use the ranking as a starting point. Compare the year. Check the method. Look at the distribution of income and the public services people can access. Then decide whether the number answers the question you started with.
Sources and method
This article uses the supplied Africa GDP-per-capita estimates from the International Monetary Fund (IMF). It ranks countries by the 2025 value and repeats the 2020 value and reported growth percentage as provided.
For background, the World Bank’s explanation of purchasing power parity explains why PPP is used for cross-country comparisons. The International Monetary Fund’s World Economic Outlook database is a widely used source for macroeconomic data. The UNDP Human Development Reports provide wider measures covering health, education, and income.
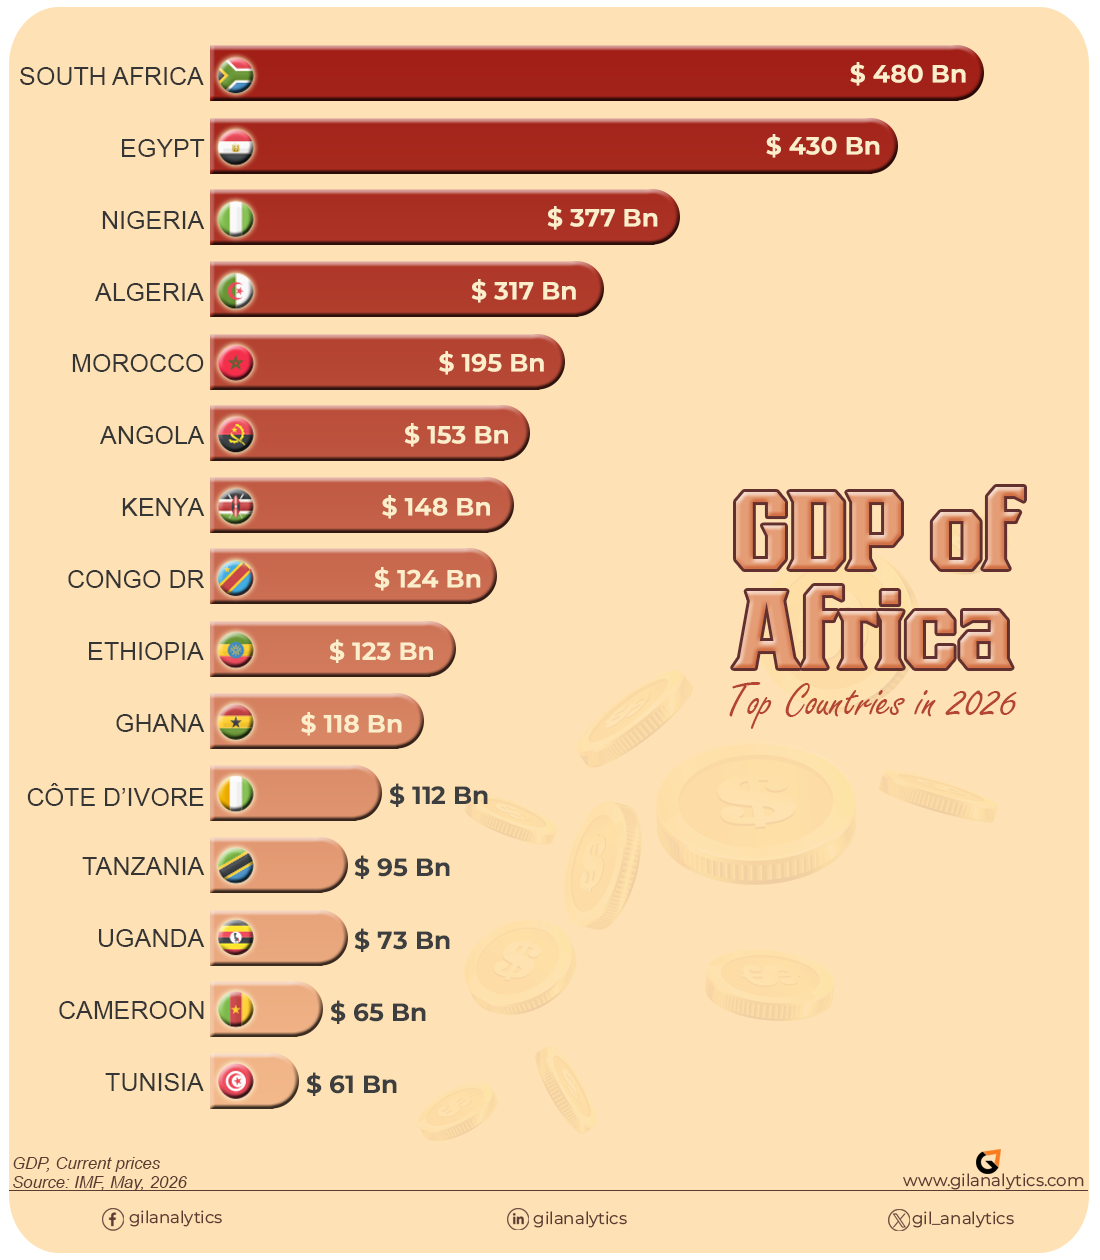
The external sources help explain the measures. The ranking and figures in this article come from the supplied IMF estimates. For a related comparison, link this article from the 2026 Projected GDP.
FAQs
Seychelles is the richest country in Africa, maintaining the highest GDP per capita (PPP) on the continent at an estimated $42,110.
Seychelles has the highest 2025 GDP-per-capita figure in the supplied table, followed by Mauritius and Gabon.
The continental average GDP per capita for Africa sits at approximately $7,900. This is significantly below the projected global average of $25,600. Currently, only Seychelles and Mauritius meet or exceed this global baseline figure.
South Africa may rank highly by total GDP, which measures the size of the whole economy. In the supplied GDP-per-capita table, it ranks ninth at $16,049.821.
Cabo Verde records the fastest GDP-per-capita growth in the supplied 2020 to 2025 comparison, at 75.0%. Rwanda follows at 73.9%.


One thought on “Richest country in Africa: Top 10 by GDP per capita (2025)”