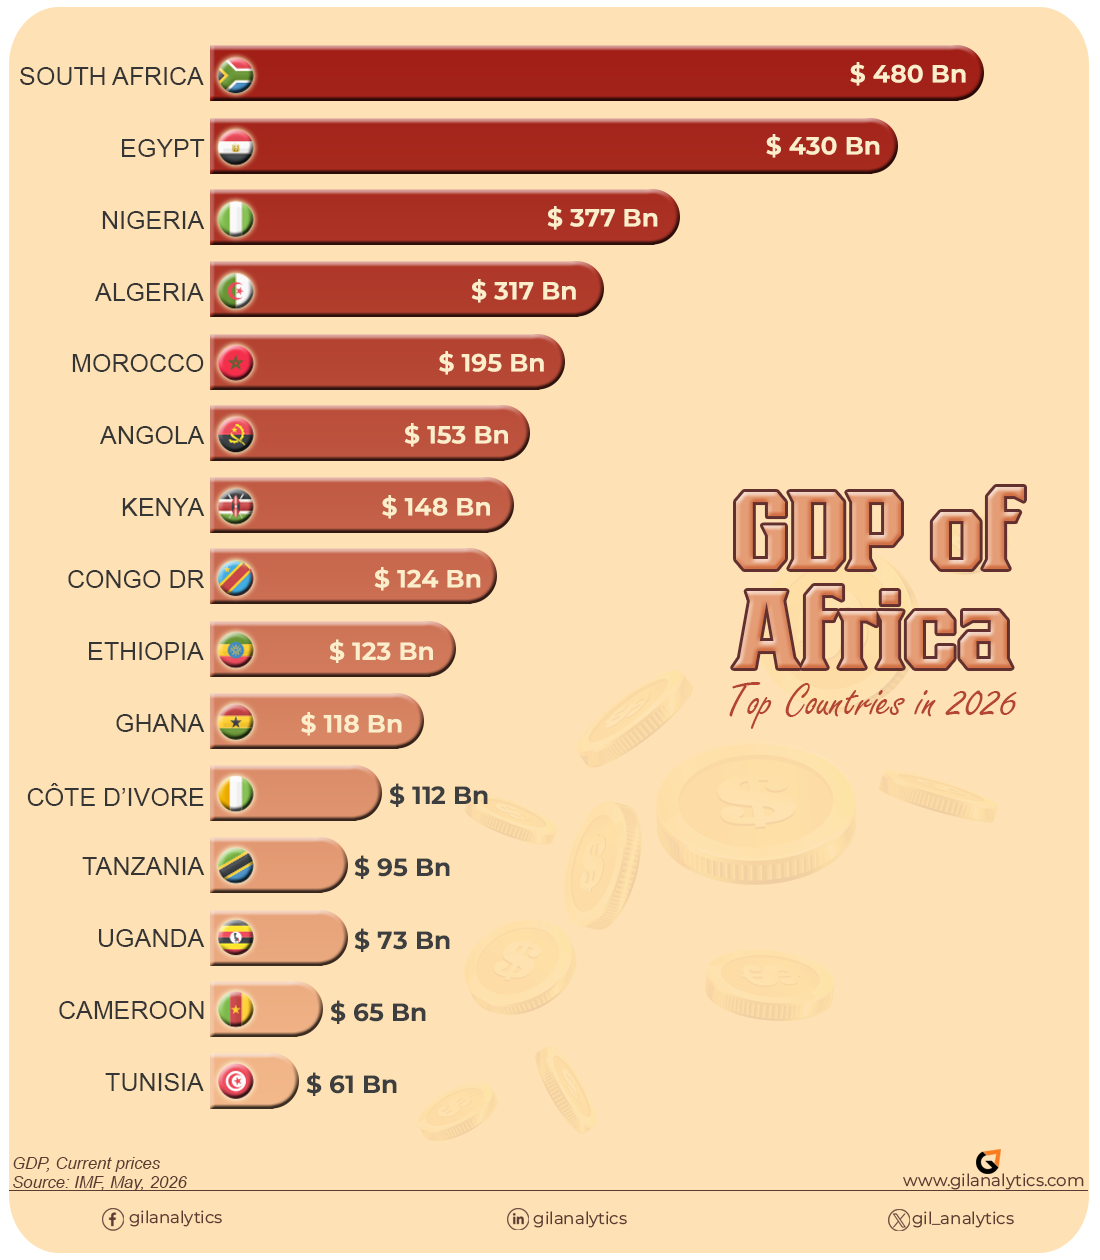
Africa’s combined GDP is projected to reach $3,56 trillion in 2026, according to IMF estimates. South Africa leads at $479.964bn, ahead of Egypt ($429.645bn) and Nigeria ($377.365bn), followed by Algeria and Morocco to complete the top five.
That’s the answer. The useful part is what sits underneath it.
Africa GDP 2026, at a glance:
- Continental total: $3,563.537bn
- Largest economy: South Africa, $479.964bn
- Top 5 share of total: 50.5%
- Fastest-growing economy: Ethiopia, 9.2% real GDP growth
- Source: IMF World Economic Outlook, April 2026
Two countries (South Africa and Egypt) produce more than the 15 economies of West Africa combined, Nigeria included. Nigeria alone outproduces every country in Central Africa put together. And a quarter of the continent’s economies (13 countries) generate less between them than Tunisia does on its own.
This article ranks all 52 economies in the supplied IMF dataset by 2026 GDP, breaks the continent into six regions with numbers that actually add up, names the fastest-growing economies alongside the largest, and points out the patterns a single ranking table tends to hide.
The number at the top
Africa’s projected 2026 GDP across the 52 countries in the dataset is $3,563.537 billion, or roughly $3.56 trillion.
To put that in perspective: it’s a similar order of magnitude to the annual GDP of a single large European economy, spread across 1.5 billion people and 52 different currencies, governments, and growth stories.
The average economy in the continent is worth $68.53bn. The median is $24.09bn. That gap between average and median is the first sign of something worth digging into. It is a strong pointer that a handful of giants are pulling the mean a long way from what a typical country actually looks like.
Read also: Richest countries in Africa in 2025
The Big Five: Half the Continent’s Output
Five countries account for just over half of everything:
| Rank | Country | 2026 GDP | % of total |
|---|---|---|---|
| 1 | South Africa | US$480bn | ~13.5% |
| 2 | Egypt | US$430bn | ~12.1% |
| 3 | Nigeria | US$377bn | ~10.6% |
| 4 | Algeria | US$317bn | ~8.9% |
| 5 | Morocco | US$194bn | ~5.4% |
Combined, that’s $1,798.48bn — 50.5% of the continent’s total GDP, from 5 of 52 countries.
That concentration matters for the same reason it always does: a currency move, a debt crisis, or an energy-price swing in any one of these five economies moves the continental number more than the same event happening anywhere else on the list.
A line on each, on what’s actually driving the number:
- South Africa ($479.964bn): Financial services, mining, and manufacturing, backed by the continent’s deepest capital markets. Energy-sector reforms have steadied a grid that spent years in crisis.
- Egypt ($429.645bn): The Suez Canal, tourism, and construction, plus a currency that’s still absorbing a multi-year devaluation and reform program.
- Nigeria ($377.365bn): Oil revenue and a consumer market of roughly 220 million people, offset by a naira that’s worth a lot less in dollar terms than it used to be.
- Algeria ($317.173bn). Hydrocarbons, largely gas exports to Europe carry most of the load.
- Morocco ($194.333bn). The diversification story of the five: automotive and aerospace manufacturing, phosphate exports, and renewable energy, rather than oil.
Nigeria sitting third instead of first is worth a note. Nigeria has held the “biggest economy in Africa” headline before, largely on the back of population size and oil revenue. Naira depreciation and rebasing effects mean its dollar-denominated GDP has fallen behind Egypt and South Africa in this projection. That’s a currency and measurement story as much as a productivity one. Nigeria’s economy is still growing at roughly 4% a year in real terms. It’s the exchange rate, not the output, doing most of the damage to its dollar ranking. More on that below.
The top 20, in full
Half the picture is five countries. Most of the picture is twenty.
The top 20 economies in the continent produce $3,103.145bn between them; approximately 87.1% of the continental total. The remaining 32 countries share the last 12.9%.
Angola (6th) runs on oil, still, though it’s pushing into agriculture and logistics. Kenya (7th) leads East Africa on finance, technology, and logistics rather than a single commodity. DR Congo (8th) sits on cobalt, copper, and lithium reserves the entire global battery industry cares about. Ethiopia (9th) combines large state-led infrastructure spending with one of Africa’s strongest aviation brands, Ethiopian Airlines.
The full 52-country table is further down, in the table below, for anyone who wants the complete dataset rather than the highlights reel.
| Rank | country | 2026 GDP (USD Billions) |
|---|---|---|
| 1 | South Africa | 479.964 |
| 2 | Egypt | 429.645 |
| 3 | Nigeria | 377.365 |
| 4 | Algeria | 317.173 |
| 5 | Morocco | 194.333 |
| 6 | Angola | 152.354 |
| 7 | Kenya | 147.265 |
| 8 | Democratic Republic of the Congo | 123.406 |
| 9 | Ethiopia | 121.527 |
| 10 | Ghana | 118.293 |
| 11 | Côte d'Ivoire | 112.115 |
| 12 | United Republic of Tanzania | 94.889 |
| 13 | Uganda | 73.37 |
| 14 | Cameroon | 65.135 |
| 15 | Tunisia | 60.745 |
| 16 | Zimbabwe | 56.713 |
| 17 | Libya | 52.453 |
| 18 | Sudan | 44.688 |
| 19 | Zambia | 41.243 |
| 20 | Senegal | 40.469 |
| 21 | Mali | 33.847 |
| 22 | Burkina Faso | 32.513 |
| 23 | Guinea | 29.93 |
| 24 | Benin | 27.786 |
| 25 | Chad | 25.628 |
| 26 | Niger | 24.813 |
| 27 | Gabon | 23.363 |
| 28 | Mozambique | 23.275 |
| 29 | Botswana | 21.937 |
| 30 | Madagascar | 21.185 |
| 31 | Malawi | 18.152 |
| 32 | Rwanda | 17.336 |
| 33 | Namibia | 17.314 |
| 34 | Mauritius | 17.119 |
| 35 | Congo | 17.028 |
| 36 | Mauritania | 14.352 |
| 37 | Somalia | 14.174 |
| 38 | Equatorial Guinea | 13.722 |
| 39 | Togo | 13.437 |
| 40 | Sierra Leone | 8.27 |
| 41 | Burundi | 8.137 |
| 42 | Eswatini | 5.792 |
| 43 | Liberia | 5.642 |
| 44 | Djibouti | 4.725 |
| 45 | Central African Republic | 3.492 |
| 46 | Cabo Verde | 3.448 |
| 47 | Guinea-Bissau | 2.985 |
| 48 | Lesotho | 2.972 |
| 49 | Gambia | 2.792 |
| 50 | Seychelles | 2.251 |
| 51 | Comoros | 1.814 |
| 52 | Sao Tome and Principe | 1.161 |
Region by region
Most “Africa by region” articles list four or five countries per region as examples. Here, each region total is the actual sum of every country in the supplied dataset that belongs to it — the six totals below add up to the full $3,563.537bn.
| Region | 2026 GDP | Share of total | Countries |
|---|---|---|---|
| North Africa | $1,099.037bn | 30.8% | 6 |
| Southern Africa | $801.564bn | 22.5% | 9 |
| West Africa | $844.609bn | 23.7% | 15 |
| East Africa | $520.76bn | 14.6% | 10 |
| Central Africa | $271.774bn | 7.6% | 7 |
| Small island states | $25.793bn | 0.7% | 5 |
North Africa: the heaviest region, on fewer economies
Egypt, Algeria, Morocco, Tunisia, Libya, and Sudan together produce $1,099.037bn; the largest regional total on the continent, from just 6 countries.
Egypt and Algeria alone are $746.818bn of that. Morocco is the diversification story here with automotive, aerospace, and renewable energy exports, rather than hydrocarbons. Libya ($52.453bn) and Sudan ($44.688bn) sit well below the region’s heavyweights, both still working through post-conflict recovery.
West Africa: Nigeria plus fourteen others
Nigeria, Ghana, Côte d’Ivoire, Senegal, Mali, Burkina Faso, Guinea, Benin, Niger, Togo, Sierra Leone, Liberia, Mauritania, Gambia, and Guinea-Bissau add up to $844.609bn.
Nigeria is $377.365bn of that on its own accounting for 44.7% of the entire region. Ghana ($118.293bn) and Côte d’Ivoire ($112.115bn) are the next tier, both leaning on gold, cocoa, and energy. Below them, the numbers drop fast: Guinea-Bissau, the smallest economy in the region, sits at $2.985bn.
East Africa: the widest spread of mid-sized economies
Kenya, Ethiopia, Tanzania, Uganda, Rwanda, Madagascar, Malawi, Somalia, Burundi, and Djibouti total $520.76bn.
Kenya leads at $147.265bn, on finance, technology, and logistics. Ethiopia ($121.527bn) and Tanzania ($94.889bn) follow. Rwanda is the smallest of the well-known names at $17.336bn, but it punches above its GDP in the governance and innovation conversation. This is a caution that a region total tells you nothing about reform or institutional quality.
Central Africa: seven countries, one that dominates
DR Congo, Cameroon, Chad, Gabon, Congo, Equatorial Guinea, and the Central African Republic total $271.774bn — the smallest mainland region.
DR Congo is $123.406bn of that, 45.4% of the region, on the back of cobalt, copper, and lithium reserves that matter to the entire global battery supply chain. Cameroon follows at $65.135bn. The Central African Republic, at $3.492bn, is one of the smallest economies in the continent.
Southern Africa: South Africa, then a steep drop
South Africa, Angola, Zimbabwe, Zambia, Mozambique, Botswana, Namibia, Eswatini, and Lesotho add up to $801.564bn.
South Africa alone is $479.964bn of that taking up 59.9% of the region’s totals. Angola is a distant second at $152.354bn, still oil-dependent but diversifying. Zambia’s copper sector ($41.243bn) is drawing renewed investor interest. Lesotho, at $2.972bn, is the smallest economy in the region.
Small island states: 0.7% of GDP, disproportionate attention
Mauritius, Seychelles, Cabo Verde, Comoros, and Sao Tome and Principe total just $25.793bn; less than Uganda produces on its own.
These economies run on tourism, financial services, and niche exports. They’re small by total GDP and consistently over-represented in “richest country in Africa” conversations, because that ranking uses GDP per capita, not total output. Seychelles and Mauritius top that list despite barely registering here.
Which economy is growing fastest
The biggest economy and the fastest-growing economy are never the same one. Ranked by real GDP growth rather than dollar size, the leaderboard changes completely.
| Rank | Country | 2026 real GDP growth |
|---|---|---|
| 1 | Ethiopia | 9.2% |
| 2 | Guinea | 8.7% |
| 3 | Uganda | 7.5% |
| 4 | Rwanda | 7.2% |
| 5 | Benin | 7.0% |
None of the top five by growth rate crack the top five by size. Ethiopia ranks 9th by total GDP. Guinea, Uganda, Rwanda, and Benin sit well outside the top 15. Growth here is measured in real, inflation-adjusted local-currency terms. It’s a different number from the nominal dollar figures used everywhere else in this article, and it’s the reason a country like Nigeria can drop in the dollar rankings while its underlying economy still expands by roughly 4% a year.
Three patterns worth noticing
A single ranking table hides more than it shows. Three things stand out once you start comparing groups instead of just rows.
1. Two countries outproduce fifteen
South Africa and Egypt combined ($909.609bn) produce more than the entire 15-country West African region ($844.609bn), Nigeria included.
That’s not a knock on West Africa. It shows that “region” is a geographic label, not an economic one. Two economies with strong services, finance, and manufacturing bases can out-produce fifteen economies built on a wider mix of agriculture, mining, and smaller-scale trade.
2. Nigeria alone beats all of Central Africa
Nigeria’s $377.365bn is bigger than the combined output of DR Congo, Cameroon, Chad, Gabon, Congo, Equatorial Guinea, and the Central African Republic ($271.774bn); seven countries.
Population and market size explain most of this. Nigeria has close to 220 million people; Central Africa’s seven countries together have roughly a third of that.
3. A quarter of the continent’s economies add up to less than Tunisia
Thirteen countries in the including Sierra Leone, Burundi, Eswatini, Liberia, Djibouti, the Central African Republic, Cabo Verde, Guinea-Bissau, Lesotho, Gambia, Seychelles, Comoros, and Sao Tome and Principe — each report GDP under $10bn.
Combined, those 13 economies total $53.481bn. Tunisia, ranked 15th on its own, reports $60.745bn.
That’s the mean-versus-median story from the top of this article, in country form: a quarter of Africa’s economies, put together, still don’t out-produce one mid-sized North African country.
What a GDP ranking leaves out
Total GDP answers one question well: how large is the economy, in current US dollars, in a given year?
It does not tell you:
- how many people that output is divided across
- whether the average person is better or worse off than last year
- how income, employment, or public services are distributed within a country
- the size of the informal economy, which is large and largely uncounted in several of these figures
- how exposed a country’s dollar-denominated GDP is to currency movements
A country with a large population and a large economy can still have low GDP per capita. A country with a tiny economy in this table like Seychelles in this case, can have one of the highest GDP per capita figures on the continent. Total GDP and GDP per capita answer different questions, and conflating them is how two accurate-looking rankings end up naming different “biggest” or “richest” countries.
Nominal GDP vs GDP per capita
This article ranks nominal GDP, i,e., the total dollar value of everything a country produces in a year, at current exchange rates.
It is not the same measure as GDP per capita, which divides that total by population, or GDP per capita at purchasing power parity (PPP), which further adjusts for local price differences.
Nominal GDP is the right measure for one specific question: which economy is largest, in dollar terms, right now. It’s the measure that determines a seat at the table in G20-style economic discussions, the size of a market for exporters, and how much room a government has to borrow.
It is the wrong measure for questions about living standards, average income, or purchasing power. For those, see the GDP per capita ranking and the difference it makes to the leaderboard.
Why the numbers differ from other sources
You’ll see different total-GDP figures for Africa depending on the source and the year the projection was made.
A few reasons why:
- Exchange rates. Nominal GDP converts local currency output into US dollars. When a currency like the Nigerian naira or Ethiopian birr depreciates, the dollar figure falls even if domestic output, measured in local currency, is stable or growing.
- Revision cycles. The IMF updates its World Economic Outlook projections multiple times a year. A figure pulled in January and one pulled in October for the same year can differ.
- Rebasing. Countries periodically update the base year and methodology used to calculate GDP. A rebasing exercise can move a country’s ranking without any change in what it actually produced.
- Current prices vs constant prices. Current-price GDP includes inflation. Constant-price (real) GDP strips it out to measure actual output growth. Mixing the two across a comparison produces numbers that don’t reconcile.
None of that makes one figure “wrong” and another “right.” It means the year, the source, and the exact measure belong in the headline — “Africa GDP 2026 at current prices, IMF estimates” is a more useful sentence than “Africa’s GDP.”
Sources and method
This article uses the supplied 2026 GDP projections, sourced from the International Monetary Fund (IMF), covering 52 African countries at current prices in US dollars.
Regional totals group each country using standard African Union / UN sub-regional classifications: North, West, East, Central, and Southern Africa, plus a separate small island states category for Mauritius, Seychelles, Cabo Verde, Comoros, and Sao Tome and Principe. All six totals sum to the full dataset with no countries omitted.
For background on the underlying measure, see the IMF’s World Economic Outlook database, which is the standard source for GDP projections of this kind, and the World Bank’s explanation of GDP methodology. Real GDP growth rates in the fastest-growing economies section are drawn from the IMF’s April 2026 World Economic Outlook as reported by Worldometer, external to the supplied dataset. For the per-person view of the same continent, see the richest country in Africa ranking, which uses GDP per capita at PPP rather than total output.
FAQs
Africa’s combined GDP is projected at $3,563.537 billion in 2026, across the 52 countries in the supplied IMF estimates; up from an estimated $2.8 trillion in 2025.
The top five largest economies in Africa by nominal GDP are:
South Africa ($480B)
Egypt ($430B)
Nigeria ($377B)
Algeria ($317B)
Morocco ($194B)
South Africa, at $479.964bn, ahead of Egypt ($429.645bn) and Nigeria ($377.365bn).
Not in USD terms. Nigeria ranks third at $377.365bn, behind South Africa and Egypt. That’s a currency story, not a collapse: Nigeria’s economy is still expanding by roughly 4% a year in real terms. Naira depreciation and GDP rebasing are what pushed its dollar-denominated total behind Egypt and South Africa.
Ethiopia, at 9.2% real GDP growth, ahead of Guinea (8.7%) and Uganda (7.5%).
Depends on the measure. By total GDP, South Africa is largest. By GDP per capita, Seychelles ranks first — a small economy with a small population, not a large one.
East Africa is widely recognized as the continent’s most dynamic growth corridor. Standard-bearers like Kenya ($147B), Ethiopia ($122B), Tanzania ($95B), Uganda ($73B), and Rwanda ($17B) are collectively building powerful momentum through financial technology, massive infrastructure projects, and tight regional trade integration.
Total GDP measures the size of an entire economy. GDP per capita divides that total by population, answering a different question: how much output corresponds to each person, on average. A country can rank high on one measure and low on the other.
Sao Tome and Principe, at $1.161bn.

