To see where is Africa’s economy really heading, one useful place to look is the IMF’s 2026 GDP projections at current prices. The figures tell a compelling story. Combined GDP of Africa is projected to reach roughly $3.56 trillion in 2026 up from $2.8 trillion in 2025.
But the headline number only tells part of the story.
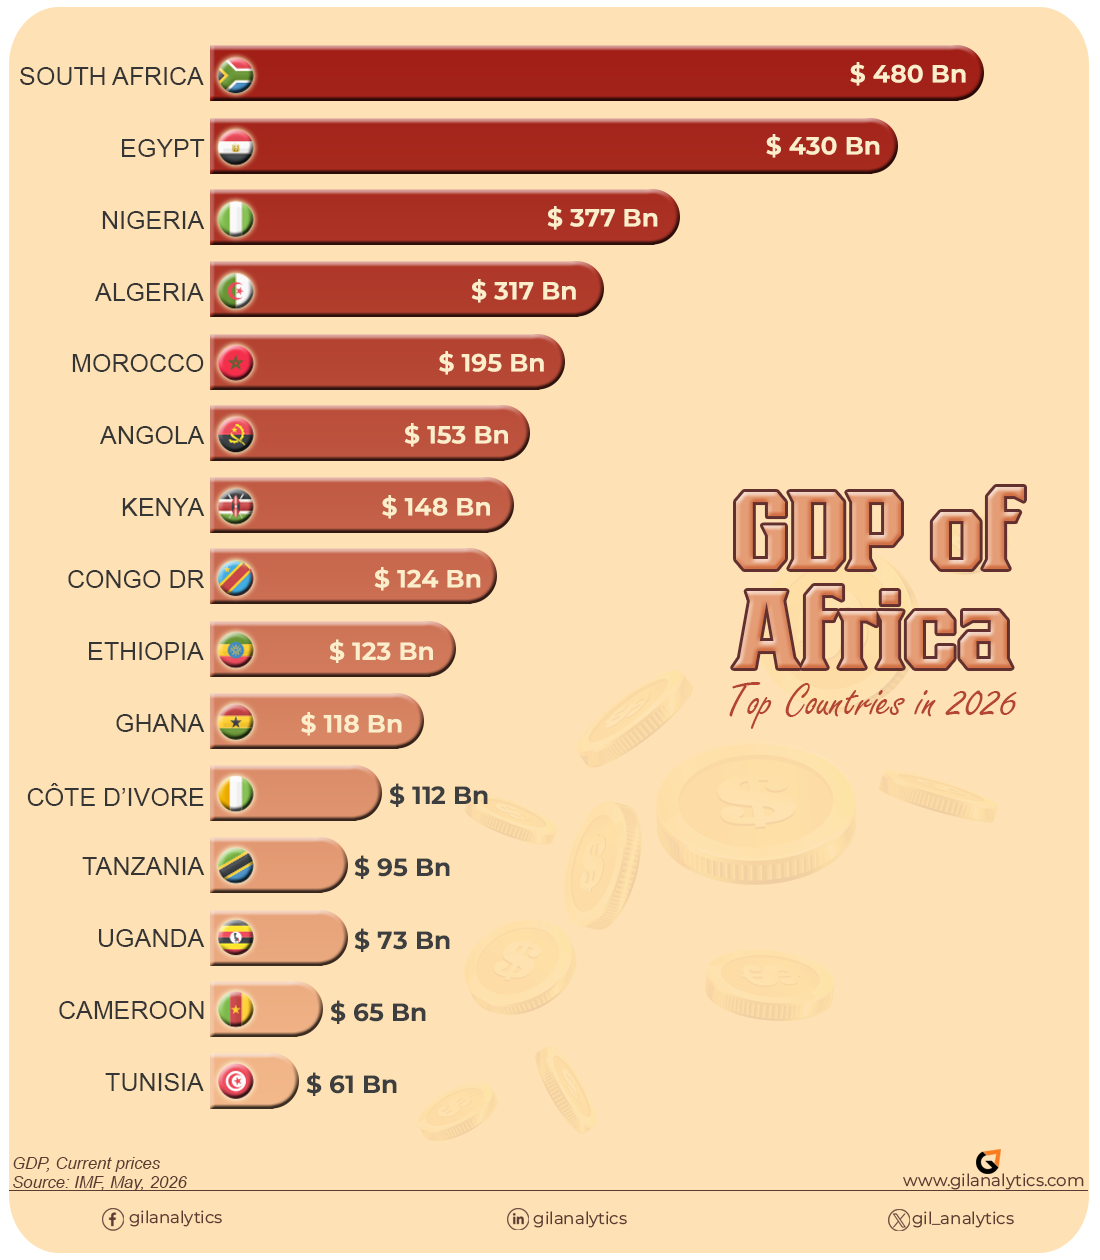
Africa’s economy is large, diverse, and increasingly dynamic. Yet it is also highly concentrated. More than half of the projected GDP of Africa comes from just five countries. These include South Africa, Egypt, Nigeria, Algeria, and Morocco.
So, who is leading? Who is rising? And what does the 2026 projections tell us about Africa’s economic future?
Read also: Richest countries in Africa in 2025
The Big Five: Half the Continent’s Output
| Rank | Country | 2026 GDP | % of total |
|---|---|---|---|
| 1 | South Africa | US$480bn | ~13.5% |
| 2 | Egypt | US$430bn | ~12.1% |
| 3 | Nigeria | US$377bn | ~10.6% |
| 4 | Algeria | US$317bn | ~8.9% |
| 5 | Morocco | US$194bn | ~5.4% |
Together, these five economies account for approximately 51% of the total GDP in the dataset.
That level of concentration matters. It means that shifts in a handful of economies can significantly affect Africa’s overall economic outlook. Currency movements, energy prices, debt pressures, reforms, infrastructure investment, and political stability in these countries will shape the continent-wide picture.
The story here is not just size but also trajectory. Egypt has been climbing steadily. Nigeria has been fluctuating. South Africa is stabilizing but not accelerating. The next decade may well reshuffle this order.
North Africa: A Region of Heavyweights and Rising Stars
North Africa remains the continent’s most economically concentrated region:
- Algeria – $317bn
- Morocco – $194bn
- Tunisia – $61bn
- Libya – $52bn
Algeria’s hydrocarbon‑driven economy keeps it firmly in the continental top five, while Morocco continues to shine as a diversified, export‑oriented hub—automotive, aerospace, and renewable energy are all fueling its rise.
Tunisia and Libya, though smaller, remain strategically important and show signs of gradual stabilization.
East Africa: The Continent’s Growth Engine
East Africa is where the long‑term growth story is most compelling.
- Kenya – $147bn
- Ethiopia – $122bn
- Tanzania – $95bn
- Uganda – $73bn
- Rwanda – $17bn
Kenya leads the region, powered by finance, technology, and logistics. Ethiopia, despite political and economic turbulence, remains one of Africa’s most structurally important economies. Tanzania and Uganda continue their steady upward climb, driven by natural resources and expanding service sectors.
Rwanda, though small, stands out for its governance reforms and innovation‑driven development model.
West Africa: A Region of Diversity and Dynamism
Beyond Nigeria, West Africa features a cluster of fast‑growing mid‑sized economies:
- Ghana – $118bn
- Côte d’Ivoire – $112bn
- Senegal – $40bn
- Mali – $34bn
- Burkina Faso – $33bn
- Benin – $28bn
- Guinea – $30bn
Ghana and Côte d’Ivoire remain the region’s rising stars, driven by cocoa, gold, energy, and expanding service sectors. Senegal’s growth is increasingly tied to offshore gas developments. Smaller economies like Benin and Guinea are benefiting from improved port infrastructure and mining investments.
Central Africa: Resource‑Rich but Uneven
Central Africa’s economies remain heavily commodity‑dependent:
- DR Congo – $123bn
- Cameroon – $65bn
- Congo – $17bn
- Gabon – $23bn
- Chad – $26bn
- Equatorial Guinea – $14bn
The DR Congo is the standout; its mineral wealth (cobalt, copper, lithium) positions it as a global strategic player in the green‑energy transition. Cameroon remains a stable mid‑tier economy, while Gabon and Equatorial Guinea continue to rely on hydrocarbons.
Southern Africa: Beyond South Africa, a Region in Transition
- Angola – $152bn
- Zimbabwe – $57bn
- Zambia – $41bn
- Botswana – $22bn
- Namibia – $17bn
- Eswatini – $6bn
- Lesotho – $3bn
Angola remains the region’s second‑largest economy, still tied to oil but gradually diversifying. Zambia’s copper‑driven economy is gaining renewed investor interest. Botswana and Namibia continue to benefit from stable governance and mineral exports.
Zimbabwe’s $57B projection reflects both recovery efforts and persistent macroeconomic challenges.
| Rank | country | 2026 GDP (USD Billions) |
|---|---|---|
| 1 | South Africa | 479.964 |
| 2 | Egypt | 429.645 |
| 3 | Nigeria | 377.365 |
| 4 | Algeria | 317.173 |
| 5 | Morocco | 194.333 |
| 6 | Angola | 152.354 |
| 7 | Kenya | 147.265 |
| 8 | Democratic Republic of the Congo | 123.406 |
| 9 | Ethiopia | 121.527 |
| 10 | Ghana | 118.293 |
| 11 | Côte d'Ivoire | 112.115 |
| 12 | United Republic of Tanzania | 94.889 |
| 13 | Uganda | 73.37 |
| 14 | Cameroon | 65.135 |
| 15 | Tunisia | 60.745 |
| 16 | Zimbabwe | 56.713 |
| 17 | Libya | 52.453 |
| 18 | Sudan | 44.688 |
| 19 | Zambia | 41.243 |
| 20 | Senegal | 40.469 |
| 21 | Mali | 33.847 |
| 22 | Burkina Faso | 32.513 |
| 23 | Guinea | 29.93 |
| 24 | Benin | 27.786 |
| 25 | Chad | 25.628 |
| 26 | Niger | 24.813 |
| 27 | Gabon | 23.363 |
| 28 | Mozambique | 23.275 |
| 29 | Botswana | 21.937 |
| 30 | Madagascar | 21.185 |
| 31 | Malawi | 18.152 |
| 32 | Rwanda | 17.336 |
| 33 | Namibia | 17.314 |
| 34 | Mauritius | 17.119 |
| 35 | Congo | 17.028 |
| 36 | Mauritania | 14.352 |
| 37 | Somalia | 14.174 |
| 38 | Equatorial Guinea | 13.722 |
| 39 | Togo | 13.437 |
| 40 | Sierra Leone | 8.27 |
| 41 | Burundi | 8.137 |
| 42 | Eswatini | 5.792 |
| 43 | Liberia | 5.642 |
| 44 | Djibouti | 4.725 |
| 45 | Central African Republic | 3.492 |
| 46 | Cabo Verde | 3.448 |
| 47 | Guinea-Bissau | 2.985 |
| 48 | Lesotho | 2.972 |
| 49 | Gambia | 2.792 |
| 50 | Seychelles | 2.251 |
| 51 | Comoros | 1.814 |
| 52 | Sao Tome and Principe | 1.161 |
Small Island and Micro‑Economies: Resilient
- Mauritius – $17bn
- Seychelles – $2bn
- Cabo Verde – $3bn
- Comoros – $2bn
- Sao Tome and Principe – $1bn
These economies rely heavily on tourism, financial services, and niche exports. Their small size makes them vulnerable to global shocks, but many have strong governance frameworks and high human‑development indicators.
What These Numbers Tell Us About Africa’s Future
Three themes emerge from the 2026 projections:
- Africa’s economic center of gravity is shifting eastward: East Africa’s consistent growth is reshaping the continental balance.
- Mid‑tier economies are rising fast : Countries like Ghana, Côte d’Ivoire, Kenya, and Tanzania are becoming regional powerhouses.
- Natural resources still matter—but diversification matters more: The countries climbing fastest are those investing in manufacturing, services, and technology.
Finally…
Africa’s 2026 GDP projections reveal a continent that is not defined by a single narrative. It is home to giants and emerging players, resource economies and innovation hubs, stability and volatility. But the overarching trend is unmistakable: Africa is growing, diversifying, and becoming more economically influential on the global stage.
FAQs
According to IMF projections, Africa’s combined nominal GDP is expected to reach approximately US$3.56 trillion at current prices.
The top five largest economies in Africa by nominal GDP are:
South Africa ($480B)
Egypt ($430B)
Nigeria ($377B)
Algeria ($317B)
Morocco ($194B)
South Africa has the largest economy in Africa according to IMF 2026 projections.
No, the economy is not collapsing. Nigeria’s drop to a projected $377 billion is fundamentally a monetary phenomenon caused by shifting exchange rates and foreign exchange unifications rather than a loss of real domestic production. Localized industrial, agricultural, and tech output remains robust, but when converted into USD at the market rate, the nominal dollar value appears smaller. However, long-term reliance on raw commodity exports without sufficient structural diversification has left its nominal GDP vulnerable to these sharp adjustments.
The “Big Five” economies collectively account for approximately 51% of the continent’s total economic output, highlighting a massive concentration of financial weight in these regional hubs.
East Africa is widely recognized as the continent’s most dynamic growth corridor. Standard-bearers like Kenya ($147B), Ethiopia ($122B), Tanzania ($95B), Uganda ($73B), and Rwanda ($17B) are collectively building powerful momentum through financial technology, massive infrastructure projects, and tight regional trade integration.
Nominal GDP measures the absolute volume of an economy, which naturally biases the data toward larger populations. While island states like Seychelles ($2B) and Mauritius ($17B) have small total economies, they boast some of the highest GDP per capita metrics and living standards on the continent due to highly successful, specialized sectors like high-end eco-tourism, offshore corporate financial services, and the blue economy.
The DRC’s rise to a $123 billion economy is heavily propelled by the global green energy transition. As a near-monopoly holder of the world’s highest-grade cobalt and copper reserves, the exploding global demand for electric vehicle (EV) batteries and renewable energy grids has funneled massive trade and investment into the country.
The IMF data used here reflects Current Prices (Nominal) GDP, which converts domestic economic output into US Dollars using current market exchange rates. It is the gold standard for measuring international purchasing power, global trade muscle, and corporate revenue scale.
PPP (Purchasing Power Parity) GDP, on the other hand, adjusts for the local cost of living within each individual nation, giving a more accurate picture of domestic living standards and localized consumer purchasing power.